

Tag transactions with the dimensions that matter. See profitability, costs, and revenue broken down by department, project, location, or any axis you define. Your chart of accounts stays clean.

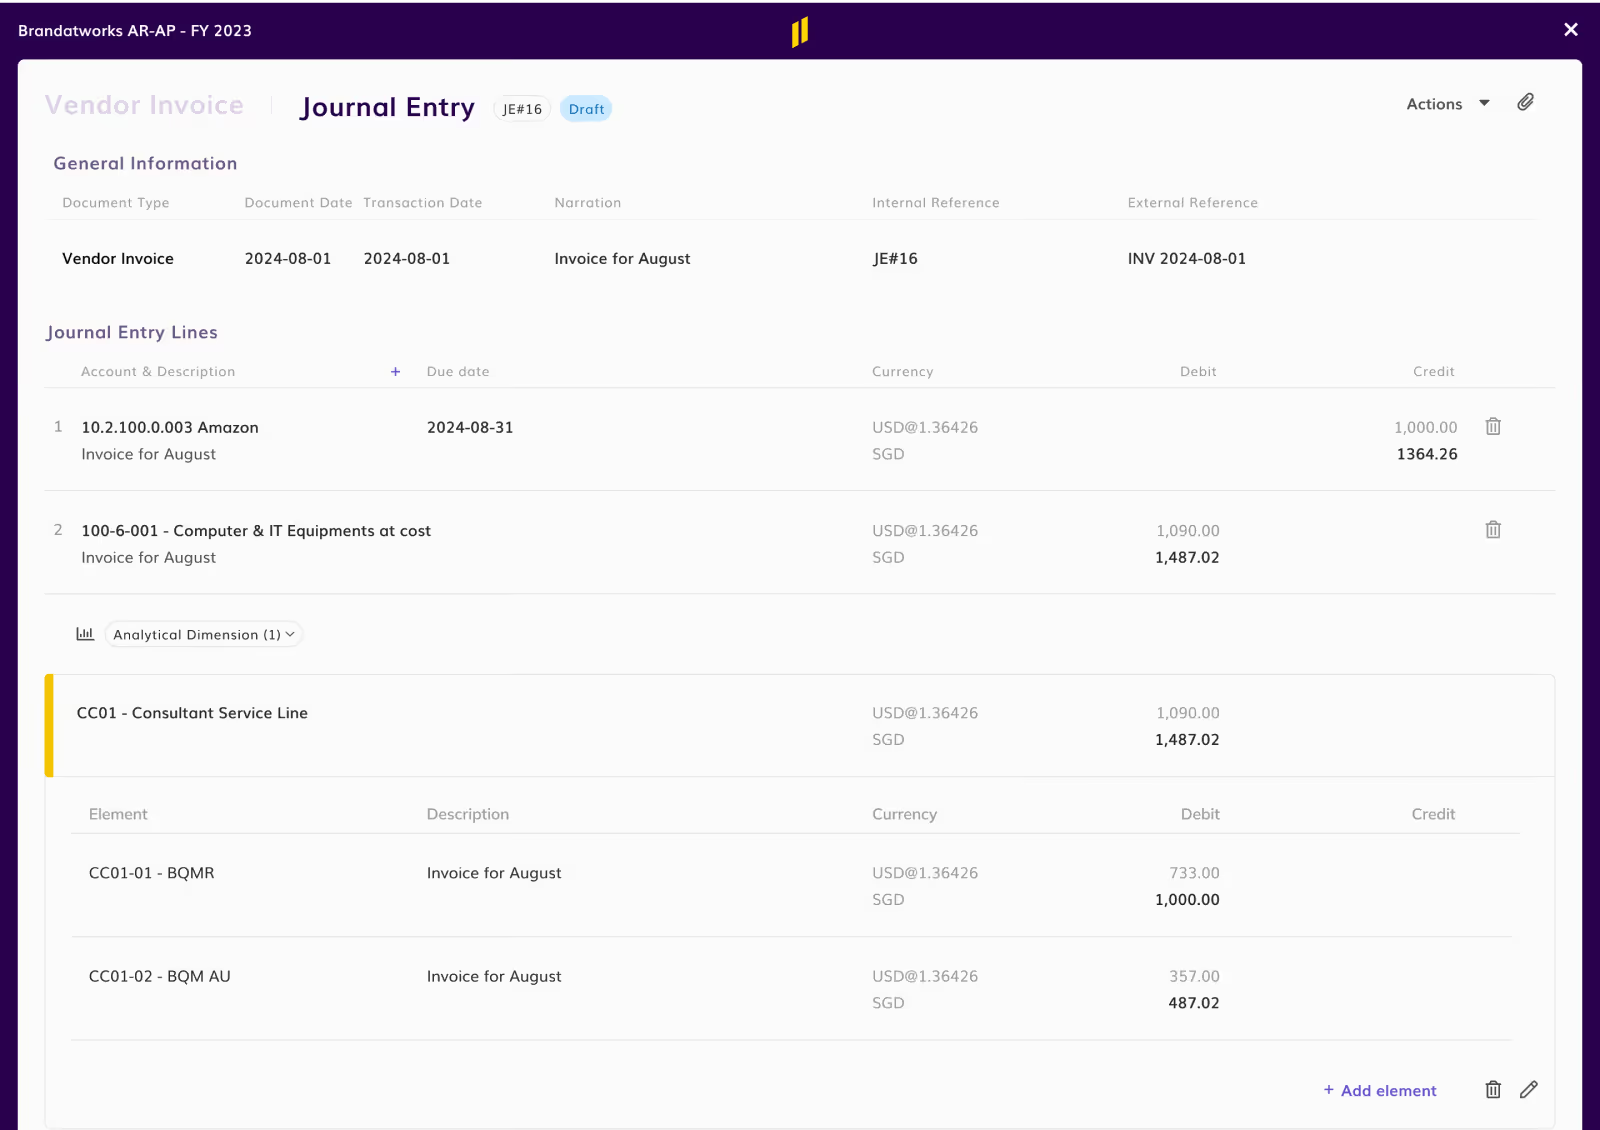

Break down financial data by multiple dimensions in parallel: departments, projects, products, locations, or cost centres. Tag every transaction with the dimensions that matter, then slice reports by any combination. Granular insight without bloating your general ledger

Dimensions work directly with the general ledger. Every journal entry carries its dimensional metadata automatically, with no separate module, batch sync, or reconciliation gaps. The analytical layer and the financial layer stay in lockstep.

Knowing total revenue tells you one thing. Knowing revenue by client segment, by service line, by region tells you something more useful. Analytical dimensions show exactly where money is earned and spent, so the decisions about cost savings and reinvestment have data behind them.
.webp)
Dimensional reports reflect the ledger as it is right now. Post a journal entry at 3pm, and the dashboard reflects it by 3:01. Every figure traces back to the journal entry and source document that produced it, with full audit trail.
.png)
Eleven's API exposes the general ledger and all its dimensional data. Connect Excel, Power BI, or any tool that supports REST APIs, and pull live dimensional data into your existing templates. The reports your analysts have built over years keep working — just sourced from clean live data instead of manual entry.
The chart of accounts captures what a transaction is (revenue, rent expense, accounts payable). Analytical dimensions capture how to slice that data: by department, by project, by location, by anything else you define. The COA stays clean and standardised; dimensions add the granularity. Done right, you get the same depth of analysis you'd get from a chart of accounts with hundreds of sub-accounts, without the maintenance burden of actually maintaining one.
Each transaction line can carry multiple dimensions in parallel. A single invoice line might be tagged with a department, a project, a location, and a custom client-specific dimension all at once.
Yes. Dimensions are configured per entity, so a consulting client tracking by project and partner doesn't have to share the same structure as a real-estate client tracking by property and asset class. Reports still work consistently across the portfolio because dimensions are structured rather than free-text.
No. Dimensions are part of how the ledger works, not a separate layer added on top. Tagging a transaction with five dimensions doesn't slow down posting or reporting any more than tagging it with one.
Standard reports (Balance Sheet, P&L, Cash Flow) use the chart of accounts and ignore dimensions. Dimensional reports use the same underlying ledger data but slice and filter by the dimensions you've tagged. Both report types pull from the same source, so the totals always reconcile.
Yes. Eleven's API exposes the full dimensional structure, so any tool that supports REST APIs can pull dimensional data into custom reports, dashboards, or analyses. The same data that powers reports inside Eleven is available externally without manual export cycles.
Both, depending on how you configure them. Dimensions can be marked as required (a transaction won't post without them) or optional (added as needed).